ISSR CLASSES
Checkpoint Science
iGCSE Chemistry
iGCSE Physics
iGCSE Coordinated Science
A-Level Chemistry
PRACTICALS
Practicals Home
Practicals A-Z
Study Plan for Practical Work
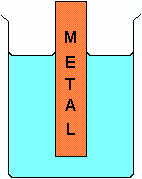
Consider placing a piece of metal in some pure water:
|
|
Some of the metal atoms will lose their electrons and the resulting positive ions will go into the solution. This leaves the electrons on the metal, and so the metal is negatively charged compared to the positively charged solution. This process cannot go on indefinitely, otherwise all the metal would dissolve. It is stopped because the increasing negative charge on the metal drags back ions from the solution to the metal, where they pick up electrons and become metal atoms again. In other words, the following equilibrium is set up: |
|
M(s) |
The difference in charge between the metal and its solution means that there is a potential difference set up between them, which would be measured in volts. This potential difference is called the electrode potential of the metal. Different metals would have different electrode potentials. More reactive metals ionise more easily and so they should leave more electrons on the metal before they reach equilibrium. In other words, the more negative the metal is, the more reactive it should be. If we could measure the potential difference between metal and solution we could use it to construct a table of reactivity from the different voltage readings. However, to measure this potential difference we would have to put a metal electrode into the solution and this would have its own electrode potential. All we can do is to compare the electrode potentials of two different metals using the following apparatus:
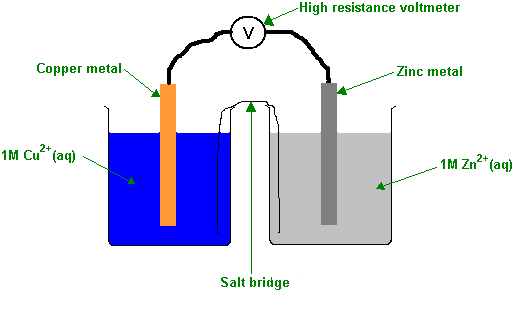
Each beaker is called a half cell, and the two beakers joined together, as above, are called a cell. A cell diagram is a shorthand way of representing the practical set up as shown above - it saves a lot of time in drawing diagrams. A solid electrode always appears at the left and the right of the cell diagram. It is these that will be connected up to the voltmeter in order to read the cell voltage. A solid vertical line indicates a boundary (usually between a solid and a solution) and a pair of dotted vertical lines shows the salt bridge (I have used :: as I can't find any more dots!). We shall see some other rules for constructing cell diagrams later, but the above is fairly simple:
|
Cu(s)½Cu2+(aq)::Zn2+(aq)½Zn(s) |
If the different metals were put into pure water different concentrations of ions would result. We make things equal by placing each metal in a 1 mol dm-3 solution of its own ions. If you are making up your own cells, it is important that you chose a salt that is sufficiently soluble to form a 1 mol dm-3 solution.
The salt bridge is usually a bit of filter paper soaked in potassium chloride or potassium nitrate solution. Without it there would not be a complete electrical circuit, and the voltmeter would read 0V. If this happens to you, it may well be that you have forgotten to put in the salt bridge.
The high resistance voltmeter is important in order that we measure the e.m.f. (electromotive force) of the cell rather than its voltage. If you are not taking physics (or even if you are!) do not worry too much about this! In the example above, the voltmeter reads 1.10V and the zinc is the negative electrode. This is to be expected, as zinc is more reactive than copper (remember the reactivity series), and the more reactive metal is always the most negative. By convention we give the polarity of the right hand electrode, so in this case we quote the result as Ecell = - 1.10V. You must be careful to include the sign - miss out a positive sign for Ecell you will lose a mark. If we reverse the cell, then the sign will change:
|
Zn(s)½Zn2+(aq)::Cu2+(aq)½Cu(s) |
Ecell = + 1.10V
If everything is under standard conditions we add a
standard sign which is the same as that which we met with enthalpy
values. The standard conditions have all solutions at 1M, pressure
at 1 atmosphere and temperature at 298 K. Then Ecell
becomes  .
.
In order to compare different half cells we choose a standard half cell by which we can compare all others. The standard half cell chosen is the standard hydrogen electrode.
Video - the standard hydrogen electrode
The following diagram shows the standard hydrogen electrode being used to measure the standard electrode potential of a copper half cell as in the video above:
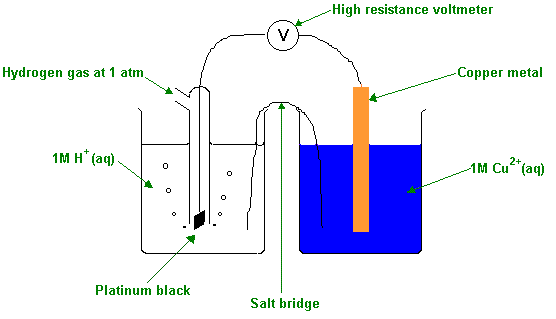
Platinum black is a type of platinum with a large surface area onto which the hydrogen gas is adsorbed. We define the electrode potential of the standard hydrogen electrode as 0.0V:
|
2H+(aq), [H2(g)]½Pt |
|
So the electrode potential of the other half cell is simply Ecell. In the above example Ecell is + 0.34 V, and this is the standard electrode potential for the copper half cell. These values are tabulated inf the data book. You will notice that there are a number of half cells quoted there which are not simple metal-metal ion systems. These are fairly easy to construct. Where there is no metal in the half equation we use an inert platinum electrode, and put all the other materials into solution at 1M concentration. Writing the cell diagram is more complicated than before, although often it is written down on the exam paper and so it can be simply copied from there or from the data book. The material with the lowest oxidation number is placed next to the platinum electrode, and separated from the other material by a comma. If there is more than one material on either side of the half equation then they are placed together in square brackets. Some examples should make this clearer, and remember you can usually get away with just copying the expression from the data book or exam paper:
|
I2(aq) + 2e- |
|
2I-(aq) |
This is simply a platinum electrode placed in a solution which is both 1 mol dm-3 in iodine and 1 mol dm-3 in iodide ions (that is one litre would contain 1 mole of iodine and 1 mole of iodide ions). Iodide has the lowest oxidation number (-1 compared to iodine at 0) and is placed next to the electrode, so the cell diagram is written:
|
I2(aq), 2I-(aq)½Pt(s) |
|
Fe3+(aq) + e- |
|
Fe2+(aq) |
A platinum electrode is placed in a solution which is both 1 mol dm-3 in iron(II) ions and 1 mol dm-3 in iron(III) ions. Iron(II) has the lowest oxidation number and appears nearest the electrode:
|
Fe3+(aq), Fe2+(aq)½Pt(s) |
|
MnO4-(aq) + 8H+(aq) + 5e- |
|
Mn2+(aq) + 4H2O(l) |
Again the platinum electrode is used, this time placed in a solution which is 1 mol dm-3 in manganate(VII) ions, 1 mol dm-3 in H+ ions (acid) and 1 mol dm-3 in manganese(II) ions. We have to use square brackets here to group together the various materials, and the manganese(II) is placed next to the electrode as it has a lower oxidation number than the manganate(VII):
|
[MnO4-(aq) + 8H+(aq)], [Mn2+(aq) + 4H2O(l)]½Pt(s) |
When you are working out cell diagrams, and the Ecell value which goes with them, make full use of the data book or the exam question where you will see the half cell representations written down. One is copied exactly to give the right hand cell, the other has to be reversed to form the left hand electrode. Do not be tempted to change the sign of the electrode potentials or to multiply them by any number. Simply use the following equation:
|
Ecell = Eright hand ½ cell - Eleft hand ½ cell |
|
What is |
|
for the following cell: V(s)½V2+(aq)::Co2+(aq)½Co(s) |
|
From the data book: |
V2+(aq)½ V(s) |
|
||
|
Co2+(aq)½ Co(s) |
|
|||
|
So |
|
= - 0.28 - - 1.18 = + 0.90 V |
||
|
What is |
|
for this cell: Pt½Pb2+(aq), Pb4+(aq)::Cr3+(aq), Cr2+(aq)½Pt |
|
From the data book: |
Cr3+(aq), Cr2+(aq)½ Pt |
|
||
|
Pb4+(aq), Pb2+(aq)½ Pt |
|
|||
|
So |
|
= - 0.41 - + 1.66 = - 2.07 V |
||
|
What is |
|
for this cell: Fe½Fe2+(aq)::[O2(g) + 2H2O(l)], 4OH-(aq)½Pt |
|
From the data book: |
[O2(g) + 2H2O(l)], 4OH-(aq)½ Pt |
|
|
Fe2+(aq)½ Fe |
|
|
So |
|
= + 0.40 - - 0.44 = + 0.84 V |
You will find further standard electrode potential data in the data book or in the reactivity series table.
 M+(aq) +
e
M+(aq) +
e = 0.0 V