ISSR CLASSES
Checkpoint Science
iGCSE Chemistry
iGCSE Physics
iGCSE Coordinated Science
A-Level Chemistry
PRACTICALS
Practicals Home
Practicals A-Z
Study Plan for Practical Work
pH changes during titrations
If you look at the strong acid-strong alkali graph you will see a near vertical rise from around pH 3 to pH 11. This is due to the logarithmic pH scale. If we need to choose an indicator for such a titration, any indicator which changes over this rapid rise will be suitable, as the end point will occur in less than one drop. Most indicators will change over this pH range, and so nearly any pH indicator can be used for a strong acid-strong alkali titration.
|
|
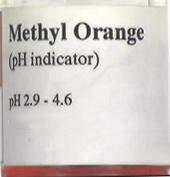
Turning to the strong acid-weak alkali graph, we see that there is a much smaller vertical rise. The jump occurs from around pH 3 to pH 6. If we need to choose an indicator for such a titration, we need one which will change colour within this range. A suitable pH indicator is methyl orange which changes from orange-red at pH 3 to orange-yellow at pH 5. Because we are using a weak alkali, the pH change over the alkaline region is much more gradual. |
|
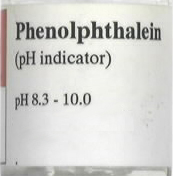
The weak acid-strong alkali graph shows a similar pattern to the last, but with the acid and alkaline regions reversed. The large, vertical jump occurs from around pH 8 to pH 11. For these titrations we usually choose phenolphthalein indicator. This is colourless at pH 8, and becomes bright pink at pH 10. |
|
A look at the weak acid-weak alkali graph shows that there is no large jump, but a gradual change throughout the addition of alkali. Consequently, there is no suitable indicator for such a titration. Such a combination of acid and alkali would never be chosen for a titration. This is never necessary, as the experimenter can always choose which acid or alkali to titrate with.