ISSR CLASSES
Checkpoint Science
iGCSE Chemistry
iGCSE Physics
iGCSE Coordinated Science
A-Level Chemistry
PRACTICALS
Practicals Home
Practicals A-Z
Study Plan for Practical Work
Results iodine propanone method 1
|
Time/min & s |
Time/min |
Titre/cm3 |
|
2' 18" |
2.3 |
39.1 |
|
8' 35" |
8.6 |
35.8 |
|
14' 44" |
14.7 |
33.1 |
|
21' 54" |
21.9 |
26.5 |
|
38' 2" |
38.0 |
22.0 |
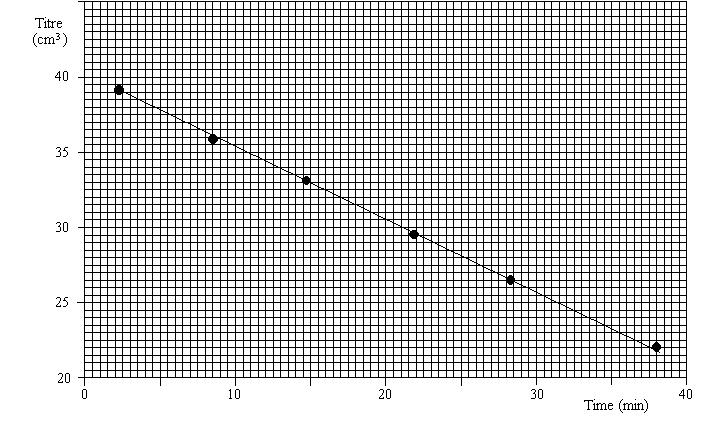
This graph is a straight line graph. As the gradient is constant, the rate of reaction is constant, and therefore independent of the concentration of the iodine solution. This means the reaction is zero order with respect to the iodine.
You should note that there are two reactants in this reaction, and both will drop in concentration as the reaction proceeds. This means that either or both reactants could be having an effect on the rate of reaction. However, you will see that we used a large excess of propanone (1.0 M) compared to the iodine (0.02 M). This means that when nearly all the iodine has been used up the propanone has hardly changed in concentration. So the propanone concentration change should have little effect on the rate of reaction in this case. The graph shape we obtain should show us the order of reaction for the iodine alone. It is perhaps easier to see this if we put some numbers in. When the concentration of the iodine drops to 0.01 M the concentration of the propanone drops to 0.99 M. If the reaction is first or second order for the propanone this will then have an effect on the rate. However, as the concentration has only dropped by 1%, the change in rate will be small and probably lost in our experimental error. The iodine has dropped in concentration by 50% and any effect on the rate will be easily noticeable.