ISSR CLASSES
Checkpoint Science
iGCSE Chemistry
iGCSE Physics
iGCSE Coordinated Science
A-Level Chemistry
PRACTICALS
Practicals Home
Practicals A-Z
Study Plan for Practical Work
|
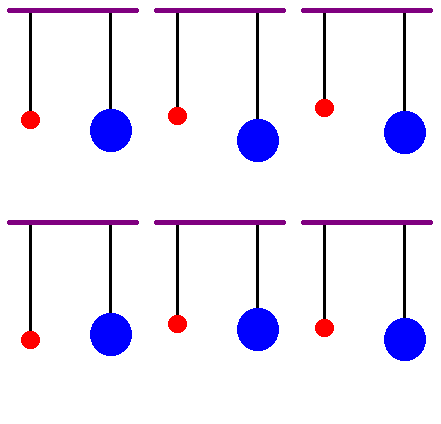
The covalent bonds in organic compounds behave like springs. They vibrate at a characteristic frequency which depends on the strength of the bond and the mass of the atoms which it attaches. These characteristic frequencies happen to be the same as the frequencies of infra red radiation (like that which comes out of a remote control handset). When a sample of a compound is irradiated with infra red radiation it absorbs different frequencies dependent on which bonds are present in the compound. The infra red spectrophotometer charts the different frequencies absorbed, and these can be used to identify the bonds present in an unknown compound, and possibly identify it. |
|
|
|
low mass atoms vibrate |
You may be asked in your exam to use the infra red correlation tables (like those on pages 40-1 of the Nuffield data book) to try and identify the bonds in a compound. If you know the molecular formula of the compound, make sure your bonds can exist in the compound. For example, if a compound of formula C4H8O2 is known to have an infra red absorption at 1200 cm-1 it might be a C-O bond - it couldn't be a C-F bond (fairly obvious, but students do still go for it!). You will notice from the data book that bonds can both stretch and bend, and these lead to different absorptions by the same group.
We usually split the spectrum up into two regions - that above around 1600 cm-1 and that below. The upper region is relatively uncluttered and can be used to identify the presence of some important bonds. You are not expected to remember any of the frequencies (they're in the data book), but it might be worth recalling the three very common groupings. C-H stretch appears just below 3000 cm-1 (and is present in nearly all organic compounds), C=O stretch appears around 1700 cm-1, and a broad absorption in the region from 2500 to 3700 cm-1 is caused by an OH stretch. The broadness of this OH stretch is noticeable and is caused by hydrogen bonding. A characteristic set of absorptions at 1450, 1500, 1580 and 1600 cm-1 is an indication of a benzene ring, though they may not all be clearly visible.
The region below 1600 cm-1 is complicated by many complex vibrations and is not used in a simple analysis. It is known as the fingerprint region and can be used to identify the compound by using computer matching from a database of known infra-red spectra.
Example

The above infra-red spectrum is that of ethanoic acid. The C=O and broad O-H stretch absorptions have been marked on the chart. The C-H stretch is barely visible just under 3000 cm-1 as it is obscured by the O-H absorption.
You can find some example problems in the spectroscopic analysis section.