ISSR CLASSES
Checkpoint Science
iGCSE Chemistry
iGCSE Physics
iGCSE Coordinated Science
A-Level Chemistry
PRACTICALS
Practicals Home
Practicals A-Z
Study Plan for Practical Work
There are a number of important features about a good graph.
The axes should be labelled and any units included. This is easy in an exam as the data will be provided for you, and the data table will include the axis labels and units. Make sure you get the axes the right way around. It is a general convention that the independent variable appears on the x-axis , but there are occasional exceptions.
|
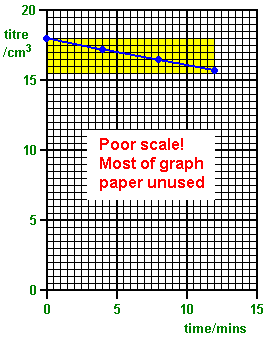
Choose suitable scales. Your graph should take up most of the graph paper, or at least half the height and width. You do not normally need to start your graphs at zero. So if your data runs from 102 to 104 don't start at 0, most of your graph will be empty! Your scales will (almost always) be linear, so that each square represents the same change in value. Scales of three are a little awkward and should be avoided. |
|
Exercise. A piece of graph paper is 28 squares by 18. You need to plot a graph with a y values from 12.3 to 18.2, and x values from 0 to 80. Decide which way round to use your graph paper (portrait or landscape) and chose suitable scales for the axes. Check your answer here.
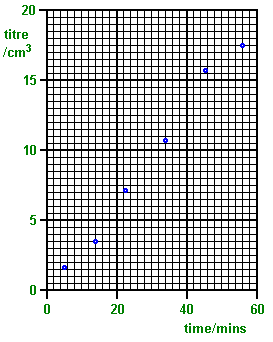 |
Plot the points correctly. Your assessor will check that each of your points is plotted correctly - so should you! Always double check any unusual point to make sure it is not an error. Look at the data below and the graph on the left. Are all the points plotted correctly? Click on the button to reveal the answer. |
||
|
time/mins |
titre/cm3 |
||
|
5.2 |
1.66 |
||
|
14.0 |
4.50 |
||
|
22.6 |
7.14 |
||
|
34.0 |
10.86 |
||
|
45.3 |
15.73 |
||
|
58.0 |
18.50 |
||
|
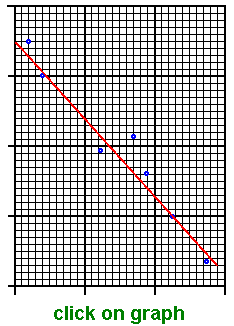
If the points appear to be in a straight line you should draw in a line of best fit. Don't try and "join the dots", but draw a straight line with a ruler so that it is as close to the points as possible. You should appreciate that the errors in an experiment make it unlikely that you will get a perfect fit - you may want to draw in some error bars . There may be the odd point that doesn't follow the pattern (an anomalous result) - identify it and ignore it for graph drawing purposes. Use a pencil to draw in your line, so that you can rub it out and try again if you are not happy with the result. Imagine turning your line about a point. Does the total distance that all the points are out from the line decrease? If so, your new line is a better fit. Take a look at the graph on the right. Can you improve the line of best fit? Click on the graph to find out. If you have a graphical calculator, you can use this to calculate the line of best fit. |
|
|
|
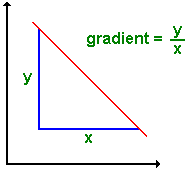
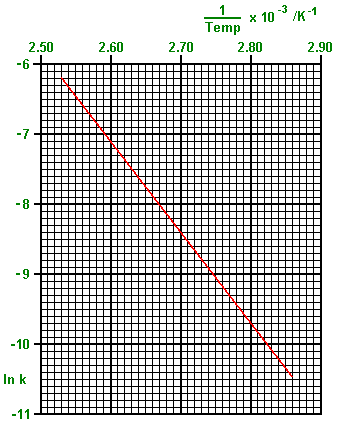
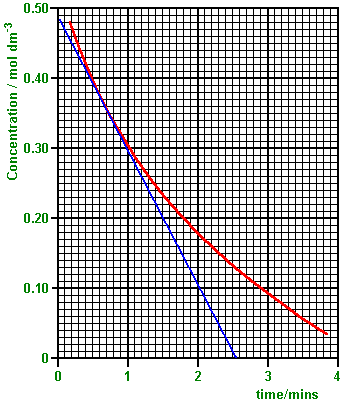
You need to be able to measure the gradient of your graph. You may have already drawn a line of best fit, as in an activation energy graph. If your graph is a curve, like a first order concentration-time graph, you can still measure a gradient at a particular point by drawing in a tangent. To measure the gradient draw a large triangle with the graph line as the hypotenuse (diagonal). The gradient is the vertical value divided by the horizontal value. |
The gradient may have units. The units will be those of the y-axis divided by those of the x-axis.
Work out the gradient in the following two graphs (in the second graph, it's the gradient of the tangent that we are looking for). Click on the graph for the answer:
 |
 |
The accuracy of a graph is limited by the quality of the plotting and even by the thickness of the pencil! Don't quote your gradient to an impossibly large number of sig. figs. Two or three significant figures should be a maximum.