ISSR CLASSES
Checkpoint Science
iGCSE Chemistry
iGCSE Physics
iGCSE Coordinated Science
A-Level Chemistry
PRACTICALS
Practicals Home
Practicals A-Z
Study Plan for Practical Work
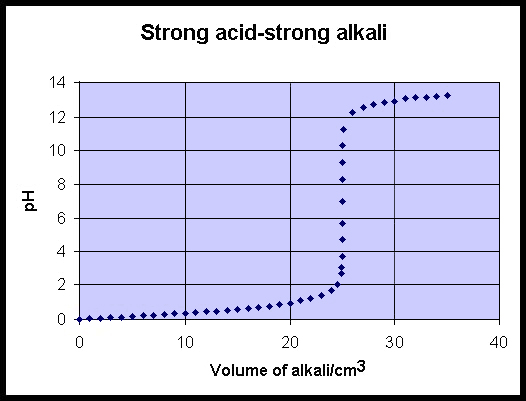
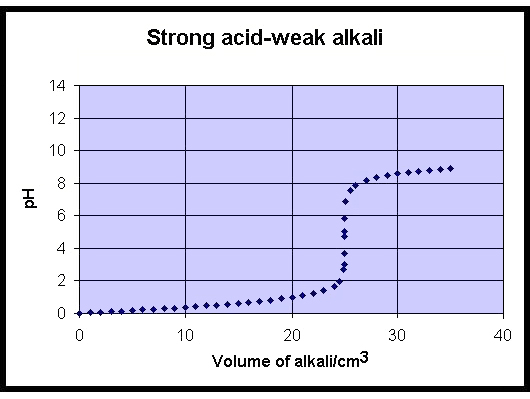
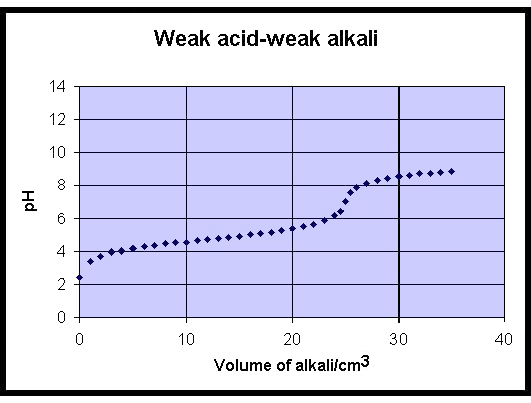
There is little to see in this experiment, so I have just presented the results. The links below show computer generated graphs for the four different experiments. Each experiment starts with 25 cm3 of 1.0 M acid in a beaker. 35 cm3 of 1.0 M alkali is then added. The pH is measured and plotted against the volume of alkali added. The strong acid used was hydrochloric acid, the strong alkali was sodium hydroxide solution, the weak acid was ethanoic acid and the weak alkali was ammonia solution.
This experiment is an important one in order to understand titration theory. Look at the four graphs presented below. The theory link gives details of the application of this experiment to titration work.
Application of these results to titration work