ISSR CLASSES
Checkpoint Science
iGCSE Chemistry
iGCSE Physics
iGCSE Coordinated Science
A-Level Chemistry
PRACTICALS
Practicals Home
Practicals A-Z
Study Plan for Practical Work
Proper error analysis is a complicated, statistical process. For "A" Level we shall take a simpler approach, but it is still a very important part of any experiment. Error analysis is equally important as any answer we produce from an experiment. It is a required part of many practical assessments, and it is usually done badly - so it pays to learn this section!
When it's incompetence! Try to avoid claiming your own careless mistakes as errors. They are not errors, they should have been corrected, and you are admitting to being poor at practical work. This is a good way to get sacked from your job or considered useless in education.
|
A common statement made by past students is to consider it an error that they may have spilt the chemicals and so not correctly weighed them. Firstly, a good practical worker does not spill materials, and secondly if they did they should start the experiment again as the results will be unnecessarily poor. Only a very poor worker will continue and use their results, and then claim the carelessness as an error of the experiment. Similarly, dirty glassware does not cause errors - clean it! |
|
"I might have calculated it incorrectly" is also not acceptable. You should have checked your calculation and you should have repeatable results.
Sometimes assessment questions will include such "errors". They usually start "A student...." or "A trainee chemist...". In this case you should spot the error and correct it. Check here for an example.
In this section we'll have a look at a list of legitimate errors. This list is not meant to be complete, so you may be able to think of some more in the actual experiment you are doing.
Measurement errors. Whenever you make a measurement, the measuring device has some inaccuracy. It is useful to know just how accurate the equipment that you are using is.
|
|
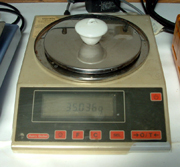
We do most of our measurement of mass on the top pan balance. If this reads to the nearest thousandth of a gram, ± 0.001 g, it cannot be more accurate than ± 0.0005 g. This is because, being digital, it cannot display a number like 0.0375 g. It would round this up to 0.038 g. Hence, our ± 0.0005 error. This assumes that the balance is actually correct when it displays a value. This is not necessary true. It depends on how well the balance has been maintained and how accurate it was in the first place. Never trust everything you read! Allowing for some drifting of the balance, a better estimate of the error is ± 0.001 g. Although the reading can be affected by passing drafts of air or even people leaning on the balance bench. If you weigh by difference (that is a before and after weighing) the error doubles to ± 0.002 g. |
|
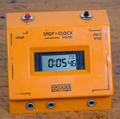
Time is usually measured with a stop clock which reads to the nearest hundredth of a second. However, read the section on human error. The clock probably is accurate to this time. So the error is ± 0.005 s. |
|
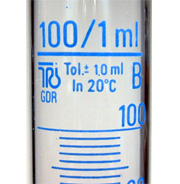
Volumes are measured using a number of devices. Never rely on the markings on beakers and conical flasks. The least accurate device we would use would be a measuring cylinder. The accuracy depends on the size of the cylinder. If the error (tolerance) is not marked on the glassware, assume it is has a tolerance of one division. This gives 10 ± 0.2 cm3 and 100 ± 1.0 cm3. It will probably be less, but it is better to overestimate an error than underestimate it. Gas syringes can be a little sticky which can lead to significant errors - an estimate of ± 1 cm3 is reasonable.
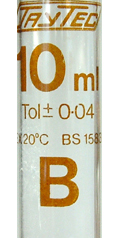
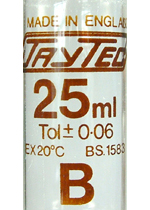
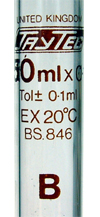
Pipettes and burettes have an accuracy which depends on the class. You can get class A and class B apparatus. Most schools and colleges use class B (the less accurate one). Class B pipette accuracy is 10.0 ± 0.04 cm3 and 25.0 ± 0.06 cm3. You can usually assume an error of ± 0.1 cm3 for a volume delivered from a burette. You can find a complete table of volume measurement errors here.
|
|
|
|
|
|
10 ml pipette |
25 ml pipette |
100 ml measuring cylinder |
50 ml burette |
Temperatures will usually be measured to the nearest 0.1 or 0.5 ºC. This gives an error of ± 0.05 or ± 0.25 ºC. However, if the thermometer has not been standardized it may be several degrees out. This applies to both electric and liquid-in-glass thermometers.
|
We are nearly always involved in measuring a temperature difference. This means that an error is made for both the initial and final temperatures. This gives a total error for a temperature change of ± 0.1 or ± 0.5 ºC (double the errors before). School and college thermometers are usually fairly accurate for measuring small temperature changes as poor standardization has less effect on the measurement of change. |
|
pH will usually be measured with a pH meter and the errors are complicated by the logarithmic pH scale. A typical school or college pH meter and probe can be unreliable and give some very poor results, but we shall assume that it is accurate to ± 0.1 pH unit. Dealing with percentage errors is complicated here, and it is probably best not to assign a percentage error unless requested to do so. You can find out more here .
Human error.
As already mentioned, this does not mean incompetence, but there are some errors which are unavoidable, even with care. If you are using a stop clock you need to consider your reaction time. This usually varies in the region 0.1 to 0.3 seconds. So if you are starting and stopping your stop clock, it might take 0.1 s to start it and 0.3 s to stop it. This would give an error of 0.2 s. An error of ± 0.1 s means that the stop clock error above is fairly irrelevant. It may also be difficult to judge the exact moment when the event you are timing occurs. To be safe, it is probably best to record time to the nearest second and give the error as ± 0.5 s.
Judging the end point of a titration can be difficult, and you will usually, at best, only get to the nearest drop. An error of ± 0.05 cm3 is a reasonable estimate of this error.
Incomplete reactions.
|
|
The most important of these is combustion. Incomplete combustion is given away by a yellow and/or sooty flame. If you are measuring the heat given out by combustion, incomplete combustion will lead to a smaller answer. Some reactions are quite slow and so may not finish in the time we have to make any measurements. Again, if we are trying to measure the heat evolved, we will get a smaller answer than we would if the reaction went to completion. It is difficult to assign a value to this error. |
Heat loss or gain.
|
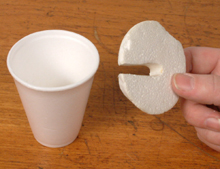
This is always a difficulty when doing a thermochemistry experiment. In many cases it will be the largest error. Remember to distinguish between heat loss or gain or you will not get the credit. Most reactions are exothermic, and so get hotter. This means heat is lost to the surrounding cup, air and thermometer. The temperature will not rise by as much as it should. Again, it is difficult to assign a value to this error. We occasionally deal with endothermic reactions. These get colder so heat is gained from the surroundings. This means that the temperature drop will be less than it should be. Heat loss will be more significant if the reaction is slow. |
|
Impurity
None of the chemical reagents used in the laboratory is 100% pure. This purity can decrease through age and contamination. An open bottle may have been contaminated and will have possibly become oxidized in contact with the air. If we were trying to do an experiment to measure the molar mass of an alkali by titration, we have to assume in our calculation that it is pure. Impurity will probably give us a smaller titre value, suggesting less moles and hence a higher molar mass.
Where there is a measurable error we can calculate a percentage error. This is much more useful than the actual size of the inaccuracy. For example, if I said that I had a measurement error of ± 1 cm, would that be good or bad? The answer is that it depends on the size of the measurement. If I am measuring the height of a 20 cm book then this is an error of 1 in 20 or 5% - not too good. However, if it is the height of Mount Everest (885,000 cm) then it is an error of 1 in 885,000 or 0.0001% - pretty good.
To work out a percentage error you need to use the following formula:
|
|
For example, what is the error in a 6.8 cm3 titre? We shall assume that the actual error is ± 0.15 cm3. The percentage error is 0.15/6.8 × 100 = ± 2.2%.
Try the percentage error exercise.
If you are obtaining a range of measurements (titres or times, for example), the smallest measurement will have the greatest percentage error. Quote the largest error in your analysis.
Having listed all the errors you can think of, decide which is the largest error. Try to justify why you think it's the largest error. This is fairly easy if you have assigned a percentage to each error, but bear in mind that the largest error may be one for which you were unable to work out a percentage. Knowing the largest error indicates the first place to adapt when we try to suggest improvements to the experiment. There is no point investing more money in a more accurate balance if the weighing error is only 0.05%, when another error is 15%.
Errors can have a number of effects on the final answer. They can always make it bigger, always make it smaller or randomly increase or decrease the result.
Some errors are called random errors. These are usually measurement errors, like reading a burette. Sometimes you will read a value slightly bigger than the correct one, and sometimes it will be smaller. These errors can make your final answer either bigger or smaller than the correct one. The nice thing about random errors is, that if you do lots of measurements of the same thing and average them out, the random error gets smaller. This is because some of the bigger answers cancel out some of the smaller answers. You don't need to understand the maths., but if I did 10 titrations in the above example and averaged them, the error would be reduced from 1.6% to 0.5%
Some errors are called systematic errors. These will always have the same effect on the answer. That is they will always make it bigger or smaller. In this case, it doesn't matter how many times you do the experiment and average the results. The final answer will always be too small or too big. Heat loss is the most common example of this type of error. If the reaction is exothermic, heat is always lost. So the number of kilojoules you measure will always be smaller than it should be.
The theory of adding errors is complicated - you need to be very good at statistics. However, for our purposes you can simply add all the percentage errors together to get a total error. This is often bigger than the actual error, but it is better to err on the side of caution. If your answer is better than you claim, then this is a bonus. If it is worse than you claim, and someone is relying on your answer, then this could be disastrous. If I calculate that the dosage of a drug for a patient is 10 ± 1 cm3, but it is actually 3 cm3 we could have a problem.
Don't forget that we have not tried to assign percentage values to the non-measurement errors. It is pointless to just make up some values for, say, heat loss. So you may not be able to give an accurate, final percentage error. Try not to claim that the total error is ± 5% if your answer is 30% away from the accepted answer. It would be better to describe the total of your percentage errors as assignable errors. Follow this with a brief explanation of any additional errors that you could not put a percentage to.
|
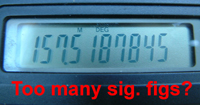
Having calculated a total percentage error, don't put in too many significant figures. For example, + 18.248 kJ mol-1 ± 10%. If we calculate 10% of 18.248, we could also express the answer as + 18.248 ± 1.8 kJ mol-1. So we are not even certain of the second significant figure - the answer could lie between 16 and 20 kJ mol-1. Any figures after these are particularly meaningless. So give your answer as + 18 ± 2 kJ mol-1. |
|
A reasonable "A" level experiment should be accurate to around 1%. This enables us to give our answer to three significant figures (although the last one is a little hopeful!). Unless you are convinced that your experiment is significantly more or less accurate, quoting three sig. figs. in your final answer is sensible.
If you have an accepted value for the experiment, calculate the percentage difference from your answer. For example, in an experiment to find a molar mass you get a value of 84.2 g mol-1. The nearest possible correct answer is 88.1 g mol-1. State that your answer differs by 4.4% (3.9/88.1 × 100) from the accepted answer.
Measurement errors can be reduced by using more accurate equipment, or by increasing the size of the measurement, or by doing both. More accurate equipment may be limited by cost. Schools and colleges usually use class B volumetric equipment, but class A can be available (a class A burette costs around £30). Balances which read to the nearest 0.001 g are fairly common in schools (they cost around £800). Balances which read to the nearest 0.0001 g are available but are rare in schools and colleges because of cost. It may be a more practical solution to use a greater mass to weigh, so reducing the percentage error. Thermometers reading to the nearest 0.1 ºC are fairly common. Those reading to the nearest 0.01 ºC are not hugely expensive, but are not often seen in schools and colleges.
Random errors are reduced by doing more experiments and averaging the results. If only one experiment has been done, this is an easy improvement - do more!
Heat loss or gain can be reduced by better insulation. For example, by adding lagging to the beaker supporting the plastic cup. Alternatively, some sort of compensation calorimetry or an attempt to estimate the heat loss or gain may reduce this error. Incomplete combustion could be reduced by improving the air supply, adjusting the fuel burning rate (eg lowering a burner wick) or by using an oxygen supply in place of the air.
A number of experiments involve taking a sequence of readings. We may get a more accurate analysis if we take more readings at smaller intervals. An example of this is the measurement of pH of an acid solution on addition of measured volumes of alkali. This is essentially a titration with the end-point occurring when there is a rapid increase in pH. In our first experiment we may measure the pH after the addition of 1.0 cm3 samples of alkali and this will establish the end-point approximately. An improved experiment would measure the pH on addition of 0.1 cm3 samples of alkali approaching the already established rough end-point. It would be easier to take a large number of readings if you used a data logger.
In preparing a standard solution it is important that the solid is pure and dry. Purification can be achieved by recrystallization. Heating in an oven at 110 ºC for an hour and keeping the sample in a desiccator should dry it. The use of a fresh, high purity reagent (see AnalaR) rather than an old GPR reagent would help.
If temperature is an important variable in the experiment, a thermostatically controlled water bath could be used to keep the temperature constant. This is particularly important in rate of reaction experiments. pH and Ka determinations are also temperature dependent.
Other improvements may be possible but will have to be judged after reading through the proposed method.
We have touched on some of these things above, but it is worth knowing the meaning of specific words.
Reliability is a measure of the consistency of a result. Ideally we would get exactly the same answer if we repeat the same measurement. Clearly, if we measure the time for a reaction three times and get answers of 10.37 s, 514.69 s and 92.11 s we are not going to have much confidence in our final answer (an average, maybe). It will not be a reliable result and we would want to work on improving the consistency of the measurement. Notice that I stated the times to the nearest hundredth of a second as many students do (it's what the stop clock said!). Given the variation in results there is no value in quoting the result to such accuracy. To the nearest second is good enough.
Accuracy is a measure of how close our result is to the "correct" one - that is the answer we would get if the experiment were perfect. If I use a digital thermometer to measure the boiling point of a liquid three times and get results of 78.2 °C, 78.2 °C and 78.2 °C I could be pleased with the reliability. However, it does not mean that the result is necessarily accurate. If the thermometer has not been properly calibrated it may be reading 5 °C too low each time. I could be more confident if different groups of researchers using different equipment were all getting the same result.
Avoid drawing conclusions on limited and/or unreliable data. I often get work in from students who have only made two measurements. It might be the enthalpy changes for the reactions between two carbonates with dilute sulfuric acid. They turn out both to be exothermic, so the student concludes that all reactions between carbonates and acids are exothermic. If, in reality, half of these reactions are exothermic and half are endothermic, then by choosing two random examples there is a 1 in 4 chance that they will both turn out to be exothermic. If you are playing Russian roulette and the gun fails to fire five times in a row, don't conclude there are no bullets in it!!
When you are confident with the above work on errors, try out the error analysis exercise. Another error problem can be found in the gravimetric section and yet more in titration problem 1 and titration problem 2. It is also worth working through the exercises in the molar gas volume section.
The above sections should enable you to do a good error analysis, but if you are keen to find out more you can look at some more advanced error analysis.